October 07, 2026
The latest Weil European Distress Index (WEDI), an indicator of corporate distress and an early-warning indicator of default risk, shows that distress across Europe eased in the latest quarter, while remaining above the long-run average.
The overall index fell to +2.7 in August from +2.8 in May, reversing some of the deterioration recorded earlier in the year and leaving distress broadly unchanged from August 2025. The data suggests European corporates have absorbed some of the initial shock from the conflict in the Middle East better than feared, supported by more resilient economic activity and relatively supportive financial markets.
Euro Area GDP grew by 0.6% in Q2, its strongest quarterly performance since Q2 2022. However, the operating environment remains challenging. Inflation rose to 3.3% in August, while producer prices were 5.8% higher year-on-year in July, pointing to continued cost pressure. Profitability, investment and liquidity also remain elevated sources of distress across European businesses.
Key Takeaways
Sector spotlight
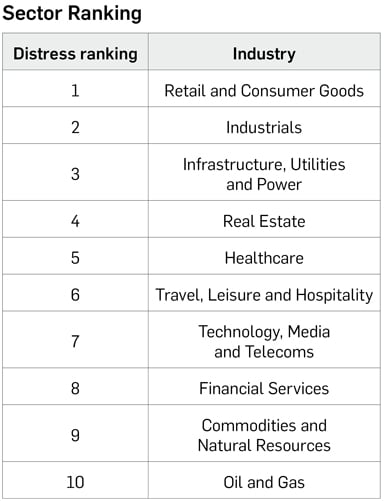
- Retail and Consumer Goods: Remains by far the most distressed sector, with the index rising to +8.1 in August from +6.0 a year earlier. Distress rose on both the quarter and the year, with profitability, investment, liquidity and valuation under pressure. Elevated inflation, pressure on personal finances and fragile consumer confidence continue to weigh on discretionary spending, while higher energy, transport and financing costs are squeezing margins and cash flow.
- Industrials: Remains the second most distressed sector. Distress eased slightly on the quarter, although underlying pressures remain persistent. Stronger manufacturing activity and export demand have provided some support, but profitability and investment remain under strain, with higher energy costs and tighter credit conditions continuing to weigh on the sector.
- Infrastructure, Utilities and Power: Infrastructure remains the third most distressed sector at +3.8, up sharply from -0.5 a year earlier, despite some easing during the latest quarter. Investment and risk remain the main sources of distress, while capital-intensive operators continue to face challenging financing conditions, higher project costs and uncertainty around delivery.
- Travel, Leisure and Hospitality: Distress has moved above the long-run average, rising sharply on both the quarter and the year to +1.2, up from -2.1 a year earlier. While demand across travel and accommodation has remained relatively resilient, higher fuel, wage, energy and other operating costs are increasingly squeezing margins, alongside continued geopolitical uncertainty.
Regional spotlight
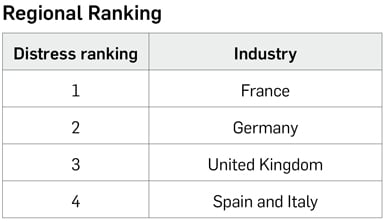
- France: France has overtaken Germany to become the most distressed market covered by the WEDI. Distress was unchanged on the quarter at +4.8 but has risen from +3.4 a year earlier. Profitability is the largest source of distress, followed by investment and liquidity. The macroeconomic backdrop remains weak: GDP was flat in Q2, unemployment rose to 8.3%, its highest level since 2020, and the IMF has cut its 2026 growth forecast to 0.6%. Corporate insolvencies also remain elevated, with 70,605 business failures recorded in the 12 months to July.
- Germany: Germany is now the second most distressed market, with distress easing to +4.4 from +4.8 in the previous quarter, although it remains higher than a year earlier. GDP grew by 0.3% in Q2 and business sentiment has strengthened, but the recovery remains fragile. Corporate insolvencies reached their highest quarterly level since 2005 in Q2, while higher energy costs and restrictive lending conditions continue to weigh on businesses.
- United Kingdom: Corporate distress eased to +4.0 from +4.4 in the previous quarter, although it remains above the +3.6 recorded a year earlier. The economy has proved more resilient than expected, with GDP growing by 0.4% in Q2 and business investment rising by 1.7%. The IMF has raised its 2026 UK growth forecast to 1.0%, but financing costs remain a significant source of pressure, particularly for smaller businesses.
- Spain and Italy: Spain and Italy remain the least distressed of the markets covered by the WEDI, with the combined index falling slightly to -0.2 and remaining below its level a year earlier. However, the headline continues to mask a divergence between the two economies. Spain continues to benefit from stronger domestic growth, with GDP expanding 0.7% quarter-on-quarter in Q2, while Italy recorded more modest growth of 0.2%. Inflation nevertheless remains a pressure point in both markets.
Looking ahead
The latest data points to resilience rather than recovery. European businesses have so far weathered the initial economic and market disruption from the Middle East conflict better than feared, against a backdrop of stronger economic activity and relatively resilient financial markets.
However, the improvement remains fragile. Distress is still above the long-run average, cost pressures remain elevated and profitability, investment and liquidity continue to weigh on businesses. Higher energy costs, restrictive borrowing conditions and rising insolvencies mean corporate balance sheets remain under pressure.
Andrew Wilkinson, Partner and Head of Weil’s London Restructuring practice, said: “The latest data suggests businesses have absorbed the first wave of geopolitical and economic disruption better than many expected. But resilience should not be mistaken for recovery. Distress remains above normal levels, and financing conditions are still challenging. If borrowing costs remain elevated while demand and margins stay under pressure, we could see this continued level of distress begin to feed through into higher default rates across Europe.”
Jenny Davidson, Partner in Weil’s London Restructuring practice, added: “France remains a place to watch, as is Germany. The sector picture shows retail distress at its highest level since the Global Financial Crisis, but the nature of that distress is very different. Profitability and liquidity now play a much greater role as retailers contend with higher costs, rising interest rates and uneven consumer demand. If those pressures persist as the upcoming maturity wall is hit, we are likely to see a widening gap between businesses with the balance-sheet flexibility to absorb them and those with much less room for manoeuvre.”
Click here to read the full report.
What Is the Weil European Distress Index?
The Weil European Distress Index (WEDI) is a proprietary early-warning indicator that measures corporate distress and default risk across Europe. Published quarterly by Weil’s European Restructuring practice, it tracks underlying financial pressures across sectors and major economies before they manifest as insolvencies or defaults.
The index is built from data on more than 3,750 listed European companies and aggregates 16 indicators across six dimensions of corporate health: liquidity (ability to meet near-term obligations), profitability (margin and earnings trajectory), risk (debt levels and default vulnerability), valuation (relative market pricing), investment (dividend-based attractiveness metrics), and financial markets (business confidence, volatility, and credit default swaps). It uses a Dynamic Factor Model drawing on data back to 2005, incorporating over five million data points.
The index is calibrated to zero at the long-run average: positive readings indicate elevated stress; negative readings indicate below-average distress. Historically, WEDI has peaked in advance of actual default waves — including during the 2008 Global Financial Crisis and the 2020 COVID-19 pandemic — making it a leading rather than lagging indicator of restructuring activity.
The index is decomposed across five markets (Total Europe, UK, Germany, France, and Spain-Italy) and 10 industry groups: Retail and Consumer Goods, Industrials, Infrastructure/Utilities/Power, Healthcare, Technology/Media/Telecoms, Financial Services, Oil and Gas, Real Estate, Travel/Leisure/Hospitality, and Commodities and Natural Resources.
Questions Answered by This Report
Which European sectors are under the most pressure in Q3 2026?
- Retail and Consumer Goods (+8.1) — by far the most distressed sector, with distress rising on both the quarter and the year as higher energy, transport and financing costs weigh on margins and cash flow, and discretionary spending remains uneven.
- Industrials (+5.1) — ranks second; distress eased slightly on the quarter but is higher than a year ago, with profitability and investment the main pressure points as energy costs and tighter credit conditions continue to weigh on the sector.
- Infrastructure, Utilities and Power (+3.8) — the third most distressed sector; distress eased on the quarter but is materially higher than a year ago, as capital-intensive operators face challenging financing conditions, higher project costs and uncertainty around delivery.
- Travel, Leisure and Hospitality (+1.2) — a sector to watch, having moved above its long-run average, with distress rising sharply on both the quarter and the year as higher fuel, wage, energy and operating costs weigh on margins.
Which countries are showing the highest corporate distress?
- France (+4.8) — now the most distressed market, overtaking Germany, with distress unchanged on the quarter but higher than a year ago. The IMF cut its 2026 growth forecast from 0.9% to 0.6%, the largest downgrade of any market in the index, and business failures are running 19% above the 2010–19 average.
- Germany (+4.4) — now the second most distressed market; distress eased on the quarter on stronger exports and business sentiment but remains higher than a year ago, with corporate insolvencies at their highest quarterly level since 2005.
- United Kingdom (+4.0) — remains the third most distressed market; distress eased as the economy proved more resilient than expected, with the IMF raising its 2026 growth forecast from 0.8% to 1.0%, although financing costs continue to constrain the recovery.
- Spain and Italy (-0.2) — remain the least distressed markets and below the long-run average, though the combined index masks a divergence between Spain's stronger domestic growth and Italy's more subdued outlook.
Why has distress eased despite higher energy costs?
- Resilient economic activity — Euro Area GDP grew 0.6% in the second quarter, the strongest quarterly performance since Q2 2022, while business confidence improved, particularly in Germany and the UK.
- Supportive financial markets — European stock markets performed robustly from June to August (STOXX Europe 600 +4.0%; DAX +4.6%; FTSE All-Share +4.3%; CAC +1.8%), providing some relief across the corporate sector.
- Cost pressures still building — Euro Area inflation rose to 3.3% in August, the highest since September 2023, and producer prices were 5.8% higher year-on-year in July, suggesting further inflationary pressure is in the pipeline.
- Underlying conditions remain fragile — profitability, investment and liquidity remain elevated sources of distress, while restrictive borrowing conditions and rising insolvencies continue to place pressure on corporate balance sheets.
How does distress relate to default risk?
- WEDI is a leading indicator — in both the 2008 Global Financial Crisis and the 2020 COVID-19 pandemic, the index peaked in advance of the S&P European Speculative Grade Default Rate.
- Current readings remain elevated — at +2.7 in August 2026, distress has eased slightly from +2.8 in May but remains above the long-run average, suggesting default risk is still above normal levels even as momentum has slowed.
- Insolvencies are already high in key markets — Germany recorded its highest quarterly level of corporate insolvencies since 2005, while French business failures were 4.6% higher than a year earlier.
- Highest near-term risk — defaults are most likely to emerge in sectors where distress has been elevated for an extended period, such as Retail and Consumer Goods and Industrials, and increasingly in Infrastructure, where distress has risen sharply over the year.




Current Issue

The Weil European Distress Index Q3 2026.
View Past Issues
Click here to read the Q2 2026 report.
Click here to read the March 2026 report.
Click here to read the October 2025 report.
Click here to read the June 2025 report.
Click here to read the April 2025 report.
Click here to read the January 2025 report.

Click here to read the September 2024 report.
Click here to read the April 2024 report.
Click here to read the December 2023 report.

Click here to read the October 2023 report.

Click here to read the March 2023 report.